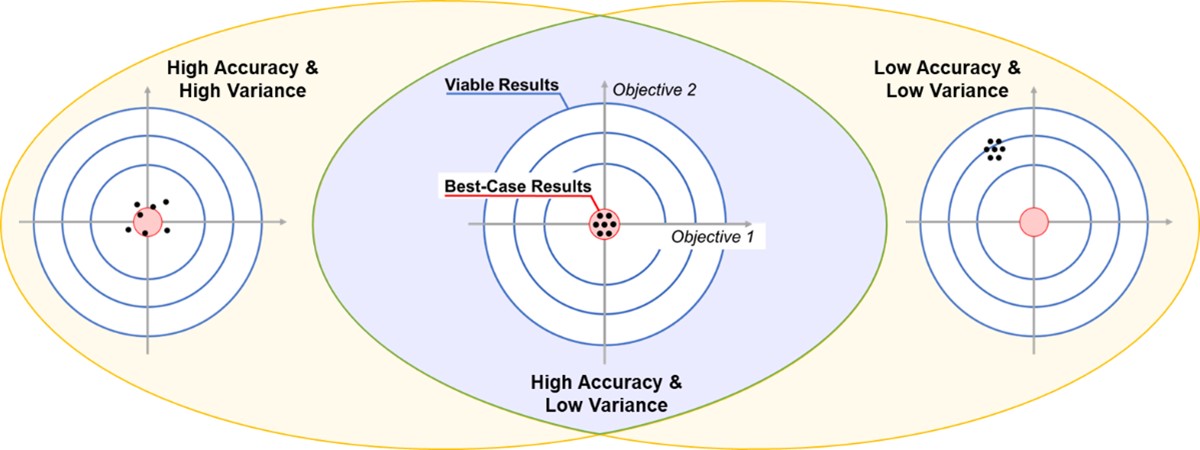
Figure 1: Illustrating the relationship between accuracy and variance.
A common topic in goal-oriented modeling is the relationship between result accuracy and variance depicted in Figure 1. The goal of any analysis is to produce sufficiently precise results at all times. However, during development, it can occur that models are accurate only in specific circumstances or produce consistent, yet inaccurate results. For example, it might occur that a model’s results predict decarbonization actions well in urban regions but are nonsensical in rural areas. This can occur if a climate action, such as “commercial afforestation,” is insufficiently constrained. Due to this, inaccuracies, such as decarbonizing forests by planting more trees, may occur. In this case, a model would not account for variance between European regions appropriately. The opposite type of error stems from a model’s accuracy. Modeling carbon capture-oriented measures in each region may be conceptually appropriate, but its universal usage would not be an accurate prediction of decarbonization solutions, due to its cost, energy demand, and further challenges.
In LOCALISED, we aim to provide comprehensive climate transition solutions for European regions, which are both accurate and consider the local regional variances.
Evaluating climate transition pathways on a European scale provides a good testing ground for these criteria, due to the heterogeneity of regions. As outlined in Figure 2, LOCALISED uses an integrated and iterative approach to hone the accuracy and variance of our produced climate action plans. Leveraging the progress made in the Horizon 2020 EUCalculator project, machine learning techniques help extract and refine regional transition pathways. An optimization platform pairs this with the LOCALISED measure database to evaluate specific measure combinations across Europe. Each process step is refined in iterative and synchronized development stages to maintain coherence and lessen variance.

Figure 2: Graphical depiction of the relationship between LOCALISED assessment modules
As the project develops, we will continue to refine our methods towards these aspects to provide actionable climate change solutions on a European scale.

Recent Comments