
Promotion LOCALISED project during local events in MAGGS

Decarbonisation is one of the most important topics in modern societies. During conferences “Municipal Energy Specialist Meeting” and “Green Retention” in Metropolitan Area Gdańsk-Gdynia-Sopot our LOCALISED team was explaining the importance of decarbonisation pathways for local authorities, citizens and businesses. Our team was also leafleting during break times. Every action to promote sustainable development is important.
First local event took place on the 6th of June in Gdynia. The annual meeting of municipal energy specialists was very popular in our region. Conference was about energy efficiency, thermal modernization of buildings, European Funds in the energy sector, and about a new modern thermal processing plant for municipal waste called “Clean Energy Port”. The event was a great occasion to hear about decarbonisation in the energy sector. ”Let’s use our success stories of today for a better tomorrow” – it was one of the most important motto during the meeting.
Decreasing the level of energy consumption directly contributes to decreasing the level of emitted carbon dioxide, so energy transformation is one of the most important ways to achieve decarbonisation goals. During break times, the LOCALISED team was explaining the LOCALISED project. What is LOCALISED? What are the LOCALISED objectives? What are the different research areas of LOCALISED? We were happy to share the information about the project. We had a booth and explained to our conference participants everything about the project. The booth was popular and people were interested in the decarbonisation topic. Many leaflets about the project were also distributed. We explained to people that the LOCALISED project is designed to close the information gap between national-level decarbonization plans and local needs for planning and implementing energy transition and climate adaptation. Shaping the future together.
We also attended the Green Retention conference (June 19-21, 2024) organized by Gdańskie Wody in Gdańsk. Green Retention is the first conference in Poland focused on practical knowledge about using greenery for managing and purifying stormwater, attracting people from all over the country. The Green Retention Conference was not only a series of lectures, but also a possibility to gain practical knowledge about how to use greenery for purification of rainwater or how to manage water supply. “Therefore, we at LOCALISED – Agata Skomar from MAGGS, along with Weronika Radziszewska and Jörg Verstraete from IMP PAN, could not miss this event” – said Agata Skomar, Climate Coordinator. During the three-day conference, the LOCALISED project was presented and encouraged attendees to support it by filling out a survey. The project received significant interest and appreciation from the guests.
Promotion of the LOCALISED project was a good occasion to talk about decarbonisation, meeting new people and making new acquaintances. It was also an interesting and fruitful event for both sides. Together for a good climate.
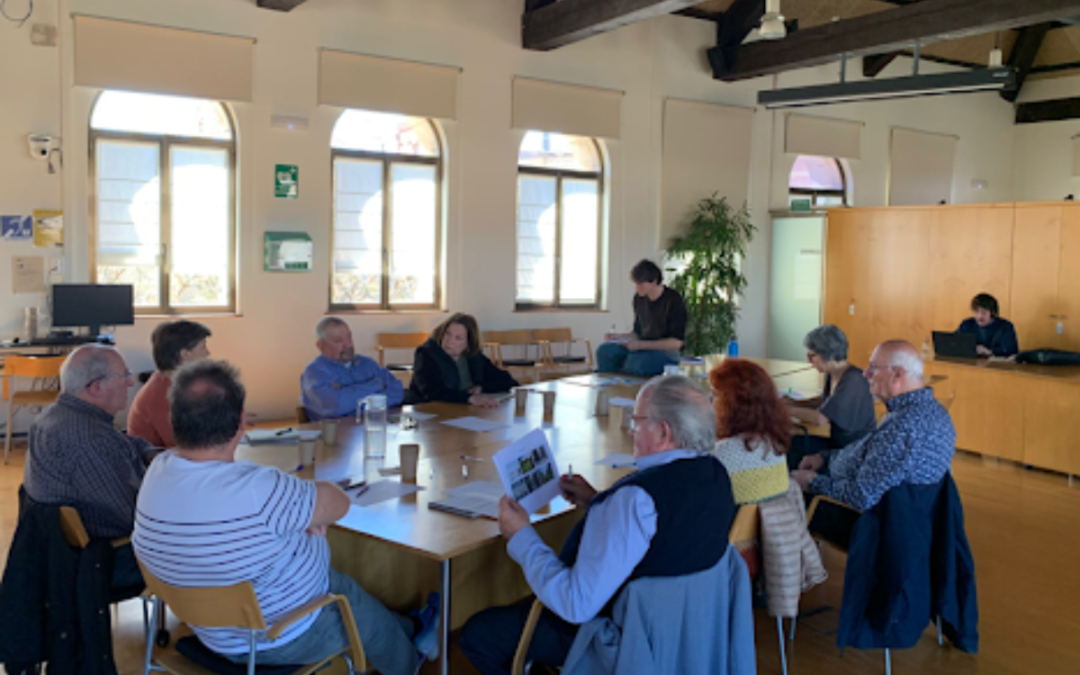
The “International Spartakiada” was held on June 15. This is an event for seniors dedicated to their activation and mobility with a focus on environmental activities. During the event, we talked about MEVO – the urban bicycle system and promoted the LOCALISED project. We talked about its goals and objectives. We talked about opportunities to protect the environment and how our choices affect the planet. We alluded to the project’s activities. Users of the event were eager to use the project leaflets and ask additional questions about the activities we are undertaking.


Recent Comments